
We've moved the Key Performance Indicators (KPI's) section to a new location on the affiliate dashboard. Some affiliates have requested an easier view of sales data, so you will find a graph for year over year sales and monthly sales/average lot price. This can be helpful in tracking your growth and profitability.
You can still view the old KPI's on the bottom of the page but we hope that these new visual charts are helpful. If you have any feedback or requests for data, please let us know. We want to provide you the data needed to analyze trends and make decisions for your company.
A reminder that our fiscal year runs from Nov. 1st - Oct. 31st. Don't forget about the Million Dollar Club, we'd love to have you as a member!
e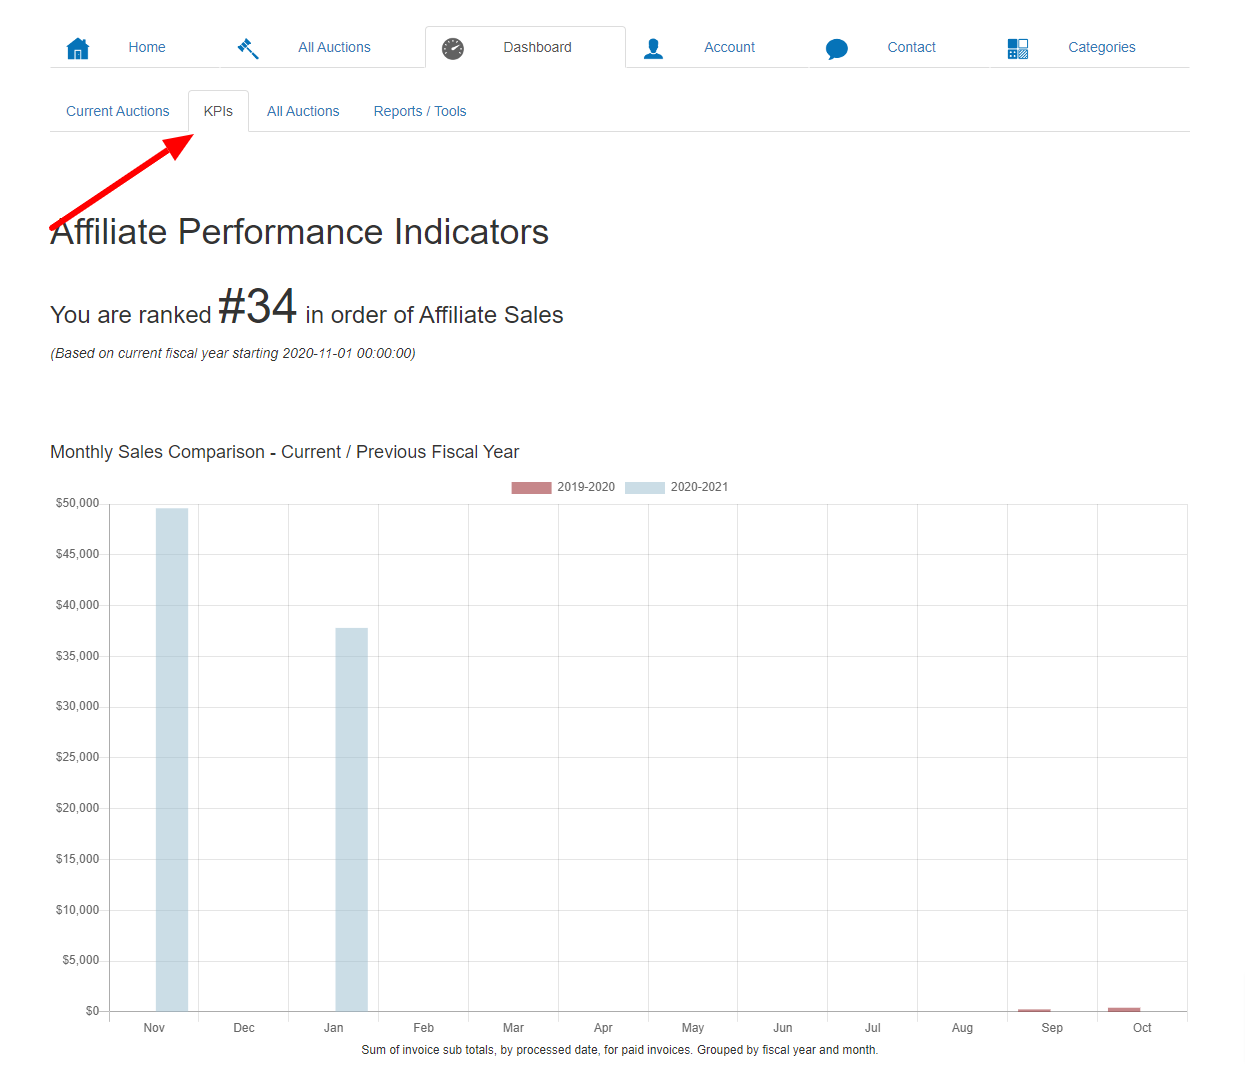
Comments
0 comments
Please sign in to leave a comment.